Streamr
We created a brand, websites and
a set of applications for Streamr,
a web3 real-time data startup.We created a brand, websites and a set
of decentralised applications for Streamr,
a Web3 real-time data startup.


We joined Zug-based Finnish startup Streamr in late 2017. Their vision for a decentralised realtime data network was appealing, and our experience with crypto and VPL-type systems were a good match for their needs. Matt took a C-level design role, and we redesigned the brand, designed and guided to implementation a set of new apps, and led the design and front end teams there for three years.
Streamr CEO, Henri Pihkala, and I preferred to avoid the sci-fi cliches that seem to be ever-present in the crypto world, and instead aimed to visualise a semi-realistic, near-future world that proposed Streamr's vision was close at hand. A stylised but detailed 3D world, seen as a kind of data diorama was the starting point. To help us realise this we brought on one of our regular collaborators, the illustrator Stuart Wade. His detailed isometric illustrations and animations helped visualise the largely invisible data products and services, along with a touch of humour.
The first app we worked on, the decentralised data marketplace, went from drawing board to MVP launch at Consensus New York 2018 in less than three months. Essentially a graphical front end to the data products which are Ethereum smart contracts, it was a good exercise in building and shipping something fast. Visit the app.
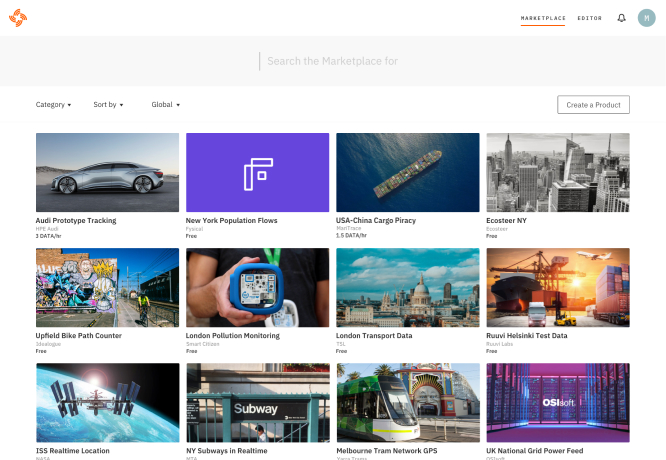
views for the Marketplace
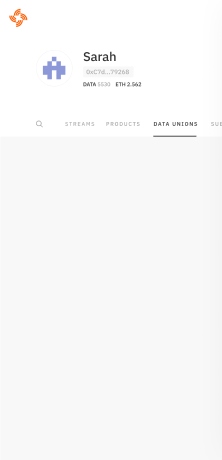
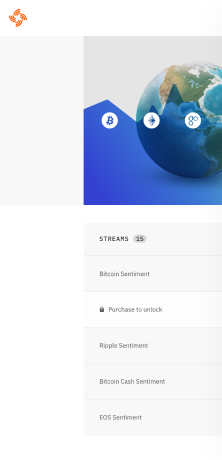
After the introduction of the Marketplace, tools and user resources were a bit all over the place. There was a VPL-type visual editor for building realtime data processes, and a stream creation tool. We gathered the resources and tools into a single app we named Core, which enabled management of streams, publishing products, and later, Data Unions from a single interface.
Working with Tim Oxley, we also redesigned and rebuilt the VPL editor, bringing it into the Core app as the Canvas editor. As of 2021 the editor has been retired as it needs to be fully decentralised to be useful, but the Core app itself has been decentralised, and you can try it out here.
RateLimit.out 6,088.73
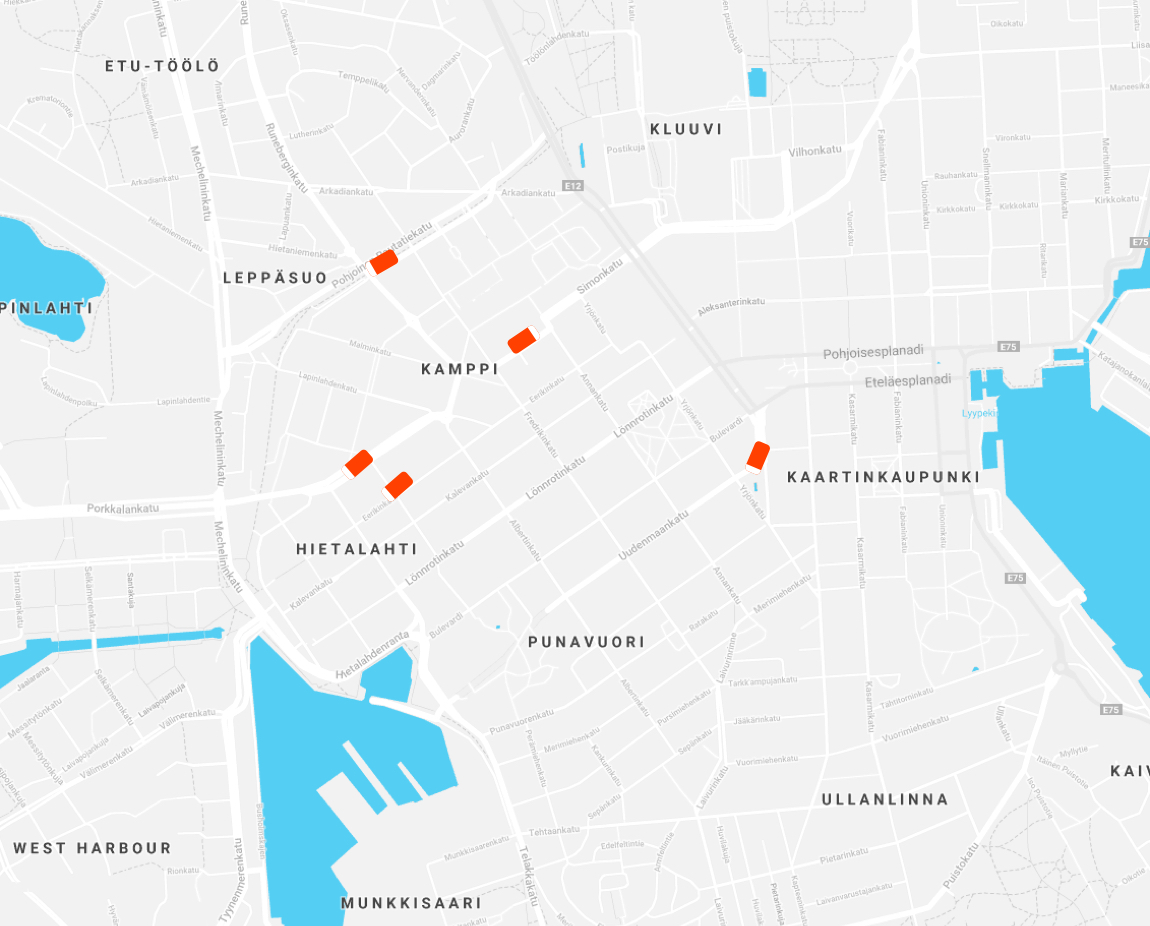
For the 2021 launch of the first public version of the network, where anyone could run a node, we designed an app to visualise the network, allow users to see streams and the nodes carrying them, and view a range of metrics for the overall network, nodes and streams. Rollout was a little rocky as up to 90,000 nodes piled into the third testnet in October 2021, but as the app matures it should provide an essential window into the operation of the global network. Try the app here.
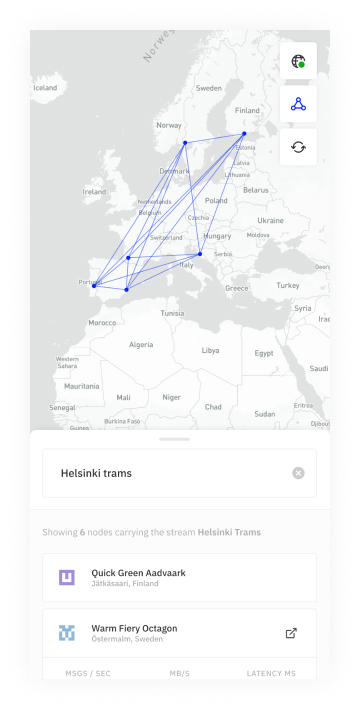
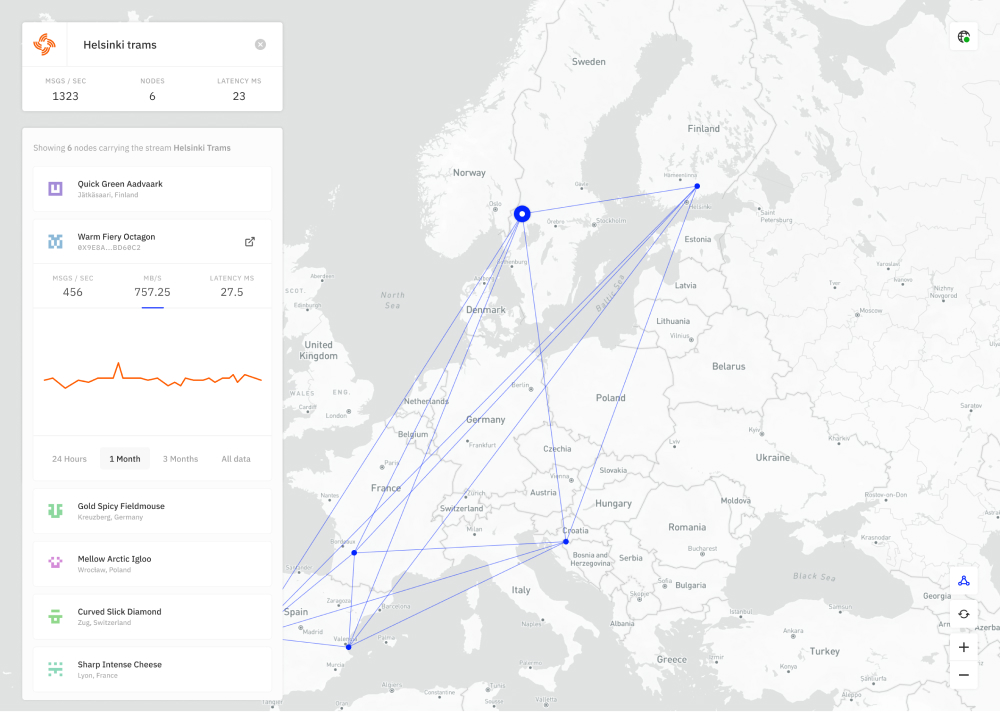
search for streams and nodes
While we designed and shipped several major project website iterations, the 2021 milestone website was the most involved. We gave the brand a refresh to make it feel lighter and wrapped that around a new site which focuses more squarely on the Web3 audience, with more realtime data, a more technical focus and a more modular design for easier updating.
With the help of Demoscene WebGL specialist Simppa, and our regular collaborator Mariusz Roliński we created an interactive visualiser for the network that ended up handling the 35,000 node testnet and still managed a quick load time & high frame rates. We also produced an animated token economics explainer with Stuart Wade, who created the icons. Visit the site.